From IEEE Journal, we got 1030 abstracts related to Virtual Reality (VR). Then created map using Viscovery SOMine. Prease refer previous article for free version which can be explore by Free Viewer (Visual Explorer).
In this time, we added 4500 keywords picture to the map. Please note that you need licensed version of Viscovery SOMine (Cluster and Classify + Enterprise Data) to explore this map below. here is the map image:

The map ordering and default clustering are the same as the maps in the previous article. Here, we disaggregate the clustering to explore it in more detail. Please note that there are 4500 keyword pictures, so displaying them all will be a load on your computer. In the image above, the attribute pictures are intentionally displayed large. When you zoom out the attribute picture, it looks like the one below:
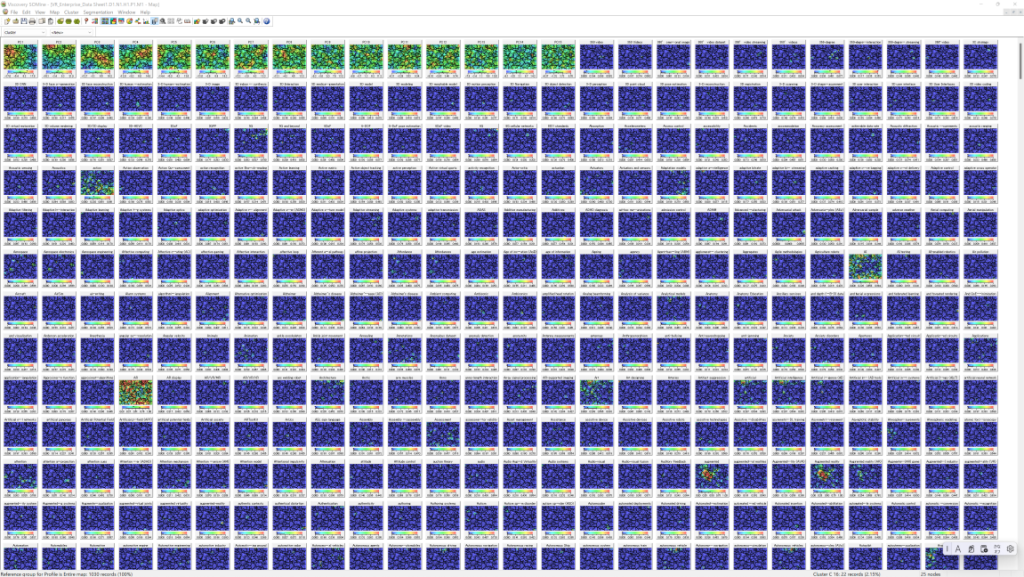
The 15 pictures from the top left to the right are the principal component scores of the Embedding Vectors of the abstract texts. In SOM learning, only these 15 dimensions contribute. 4500 keywords are subordinate to the principal components.
How to explore Technical Papers
Keyword pictures are arranged alphabetically, so you can easily find the word you are interested in. Switch Visocvery SOMine to “Selection mode” and select the red part on the color scale at the bottom of the attribute picture of the keyword you are interested in.(Please learn the details of software operation from the manual). Then, nodes corresponding to candidate papers that you might be interested in will be marked.
In this state, Data Records Windows should display many paper titles. From here, start narrowing down the “concept” of the papers you are aiming for.
By carefully examining all the keyword pictures, you will develop a familiarity with the entire map, like to get land knowledge. The upper left of this map is related to “education”, a little to the right is the “Metaverse” area, further to the right is “autonomous driving”, and from the upper right area to the center is the “Internet” and “mobile wireless communication”. Below that are areas related to “video content” and “computer graphics”. From the bottom right to the center is the “neural network” and “machine learning” area. The lower left area contains areas related to the “human body” and “cognition”. and the above is “trainning”. The center has to do with the “display”, which is the central theme of VR.

Then turn off the “Selection mode” and change the selector to “Nearest Nodes”. And set the number of Nearest Nodes to 15. Clicking on any of the marked nodes will display similar papers corresponding to that node in the Data Records window. And the coressponding Keywords in Goroup Profile window. As you click on different parts of the map, you will get a sense of what papers are located on the map.
To find out what similar papers have in common and how they differ from other groups of similar papers, it would be a good idea to save time by having LLMs read the titles and abstracts of the papers.
By repeating this process, you should be able to find out which group your research topic belongs to and scrutinize the papers around it to gain knowledge that will be useful for your research. Or, if there is more than one group of interest, it would be useful to consider what concepts could be created by combining them.
It would be very interesting to use the reasoning capabilities of LLM to build new ideas and concepts. For example, given an empty node on the map, what would happen if we gave it the abstracts of the surrounding papers and their PC scores, and let it create its abstract from the PC scores of the empty node? As far as we have experimented with the business idea map so far, we have been able to get some realistic answers there, but it will be interesting to see how well it handles academic content.
In other words, this is to use the mechanism by which the LLM causes halucinations, so we are likely to get unrealistic answers, but in terms of “creation,” it should be quite possible that certain mistakes could become a hint.