In a typical data science course, self-organizing maps (SOMs) are likely introduced as a method for data visualization, dimensionality reduction, clustering, and exploratory data analysis. Because it can be used for so many different purposes, it’s easy to lose focus as to what it should ultimately be used for. Therefore, it tends to be treated as a complementary tool in today’s data science projects. In this post, we try to explain that SOMs play a key role in building advanced ensemble models.
What is ensemble technique?
There are various methods for machine learning, each with its own advantages and disadvantages. No single method can be applied to every issue or to every type of data, and it is considered important to use different methods in the right place at the right time. This is often explained in association with No Free Lunch Theorem, but strictly speaking, No Free Lunch Theorem is related to the importance of prior knowledge utilisation. Be that as it may, it is often effective to combine several models rather than a single model to improve the performance of a model.
The approach of combining multiple models in machine learning is called ensemble techniques. It is said that the top-ranking models in machine learning competitions are made up of dozens models layered. Machine learning processes are often coded using Python libraries, but if you only intend to use individual machine learning methods in a basic way, there’s little point in sticking to Python. The task of a data scientist is to combine different functions available from libraries to build a series of pipelines, with ensemble techniques being the highlight.
Ensemble techniques are developed by top data scientists competing with each other, and there is no set format for them, but three types are commonly described:
Bagging
Bagging is an abbreviation for “Bootstrap AGGregatING.” Bootstrapping is a statistical method for estimating a sampling distribution by drawing random samples. Randomly select multiple training data and use them to create a predictor/classifier. Collect all the results and make a final decision. For predictors, the average value is used, for classifiers, majority vote is used.
Bagging is the simplest ensemble technique and is widely used. In general bagging, the only choice made is whether or not to input each attribute into the model, and the final result is a very simple decision such as averaging or majority voting. A common example of bagging is Random Forest.
In contrast, if you use SOM for baging, you can give weights to each attribute. In other words, in addition to “exclude” of 0 and “include” of 1, you can also give intermediate weights such as 0.5. Furthermore, when judging the final results, you can use only the results of local spaces where each model has high performance based on the accuracy rate or error rate of each area of the map. This is a technique I used in the early 2000s, before I even knew the term “ensemble” and before people around me were even aware of it. (However, instead of random sampling, I used experimental design to assign weights.)
Boosting
Boosting is a technique for improving the performance of a model by using the residuals or error rates of the first basic model as target attribute for the next model. The prediction results of the first model are combined with the prediction results of the second model to obtain a more accurate prediction result. This process is repeated to obtain the final result. Therefore, this is a computationally intensive technique.
Viscovery’s SOM local regression method can be considered as one example of this. This was launched on the market as a product called Viscovery Predictor in 2003. I recall that the price at the time, including consulting, was around 50,000 euros. This was also explained without using the terms ensemble or boosting.
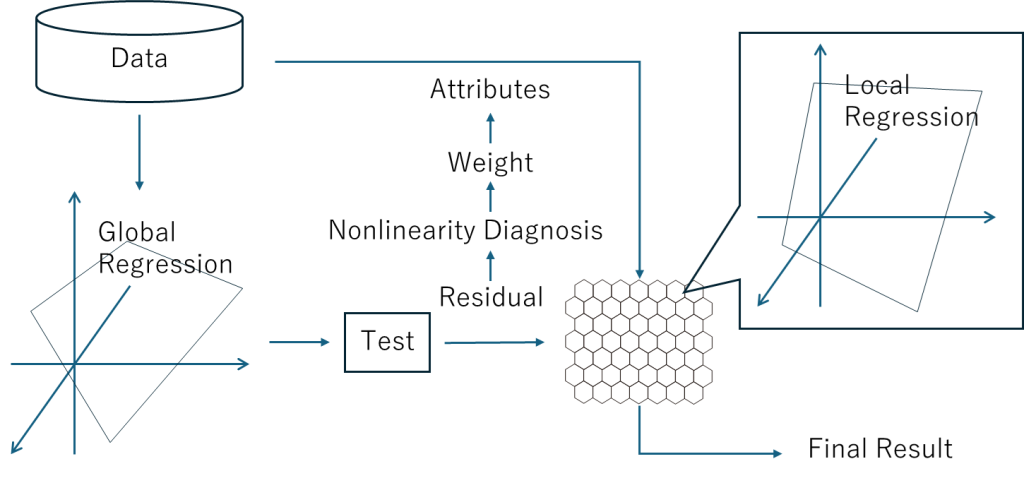
First, we create a linear regression model, and then use the residual as the new target attribute to create a second regression model. However, second and subsequent regression models are built at each node in the SOM. A receptive field is set for each node, and data records are collected with weights reduced according to their distance from the node. Also, nonlinearity of each attribute is diagnosed and attribute weighting is updated accordingly. As a result, the SOM local regression method can use over 1000 regression models.
It is truly amazing that such an advanced ensemble technique was developed in 2003. Companies like Google, Amazon, and Microsoft entered the data science market much later, and Viscovery was two or even three steps ahead of the market. To be frank, it’s not necessarily true that Viscovery’s business has been successful. Although it had some temporary success in the 2000s, as the data science market began to gain momentum around 2010, it was left behind by the trend towards data science that made Python the standard.
While data science allows data scientists to freely code their pipelines in Python, Viscovery got ahead of itself by providing automated workflows too early, which resulted in fixed pipelines. However, the SOM local regression method defines a solid framework for ensemble techniques using SOMs and remains a timeless technique.
Stacking
Stacking is considered to be the most advanced and promising of the ensemble techniques. There are various machine learning algrithms, such as gradient boosting models (GBM), neural networks (NN), factorization machines models (FM), support vector machines (SVM), and logistic regression (LR). First, we use each of them separately to make predictions, and then create a meta-model using those prediction results as new inputs.
That is, the metamodel learns patterns in a multi-dimensional data space of prediction results from many single models, and gains the ability to adopt the best prediction result depending on the situation. We propose to create this metamodel using SOM. As explained in the bagging section, SOM can identify the accuracy or error rate of each model in local space, so that each model can be used in the appropriate place to achieve the best performance. In other words, it’s like forming an idol group with a group of top idol-level individuals full of personality, and having each person sing the part in which they shine the most.
Accelerating No-Code Ensemble Machine Learning
Currently, the prevailing trend is that “if you want to start machine learning, you should first study Python,” but this trend is about to change. This is because advances in LLMs (large-scale language models) are leading to increased automation of coding, and the trend is shifting towards no-code and low-code. The reason Python is needed in the first place is to automate complex tasks, and the no-code and low-code wave is sweeping over this area. Gone are the days when a machine learning beginner could write a canned script, build a simple machine learning model, and call themselves a data scientist.
The conditions are already in place for Viscovery SOMine to become the core of ensemble machine learning. Individual machine learning models can now be easily built. In some cases, we can easily provide tools to build machine learning models in a GUI environment. It is easy to collect the predictions and test results of those machine learning models and build a metamodel in Viscovery SOMine. While this is still possible today, it is highly expected that Viscovery SOMine will augment this related functionality in the future.